Churn Prediction with Spark
Churn is defined as the event when a user leaves or unsubscribes from a service. Predicting this event is already an important part of businesses as Netflix, Spotify and YouTube. When predicting this event, companies can offer incetives so the user doesn’t leave the plataform, potentially saving a lot of money. Other than that, it’s also an opportunity of understanding why users are leaving the product, and which improvements can be made.
In this case, I’ll be using pySpark, a Python API for manipulating distributed datasets and creating machine learning models. In this case, I will create a classification model that will predict if a user churned or not. With Spark, it’s easier to handle datasets that don’t easily fit into memory.
The Dataset
I’m gonna use a dataset provided by Udacity. It contains data from the Sparkify app, a fictional music streaming service. Each line of the dataset contains one user behavior, indicating which user made an action in the app and which page it was.
Let’s get started!
Exploratory Data Analysis
Loading data
It’s easy to load the data using the following command:
df = spark.read.json('mini_sparkify_event_data.json')
I also need to create a temporary view, where I can use SQL querys to investigate the data. It’s necessary to pass a name as argument:
df.createOrReplaceTempView('sparkify_data')
First let’s have a glimpse of the dataset:
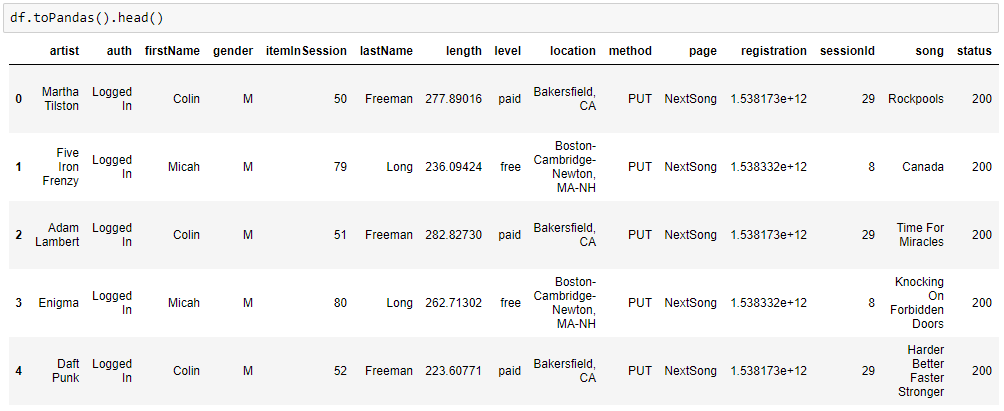
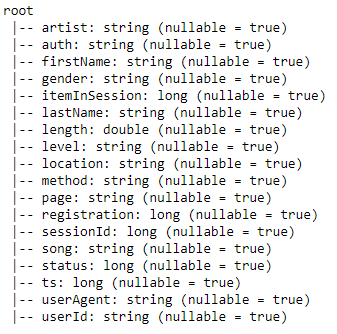
Indeed, each line indicates one user behavior, where it’s possible to see which page the user was at, if he was listening to any music, gender, id of the session, user name etc. Now let’s check all the columns and it’s types.
The number of lines can be easily obtained with the count() function:
df.count()
That outputs the number of 286500 lines.
Unique users
It would be interesting if we had the number of unique users:
spark.sql("""select count (distinct userId) from sparkify_data""").show()
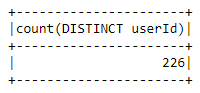
There are 226 unique users in the dataset.
Let’s check how frequent each user is in the dataset with the following query:
spark.sql("""select userId, count(userId) as count
             from sparkify_data
             group by userId
             order by count desc""").show()
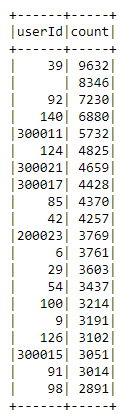
Looks like we got a Null value that happens 8346 times. I’ll investigate this later.
Page frequencies
Now let’s figure out how frequent each type of page is:
spark.sql("""select page, count(page) as count
             from sparkify_data
             group by page
             order by count desc""").toPandas()
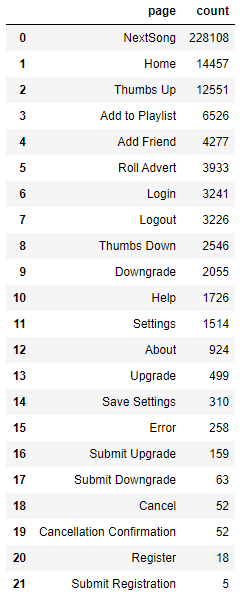
From this I can draw some conclusions:
NextSongis by far the most frequent page, which makes sense in a streaming service.Submit Registrationis the least frequent page.- The column
Cancellation Confirmationwill be used to define churned users. - There are 22 possible pages.
- With
pagecolumn it’s possible to create new features like number of friends, listening time, number of listened songs, number of thumbs up, etc. for each user. This will be done in the feature engineering step later on.
Free/paid users proportion
What about free/paid users?
df.groupBy('level').count().show()
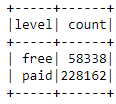
There are almost 4x more paid users than free users.
Gender proportions
What about gender proportions?
df.groupBy('gender').count().show()
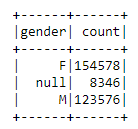
There are 8346 Null values in the gender column, the same value we found in the userId column. This probably refers to users that don’t have an account in the app. These values will be dropped later in the feature engineering part.
Feature Engineering
The feature engineering process will be composed of dropping the null values we found earlier and constructing the folowing features for each user:
- Listening time
- Active days
- Number of sessions
- Number of listened songs
- Number of thumbs up
- Number of thumbs down
- Number of added friends
- Churn flag
Most of the features will be build using SQL commands.
Dropping nulls
To drop users without id, we can use the Spark method filter:
df.filter(df.userId != "")
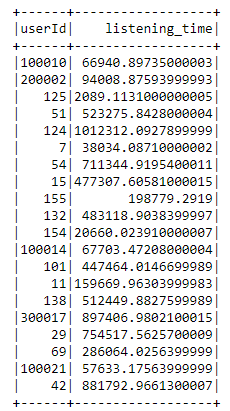
Listening time
listening_time = spark.sql("""select userId, sum(length) as listening_time
                              from sparkify_data_churn
                              where page = 'NextSong'
                              group by userId""")
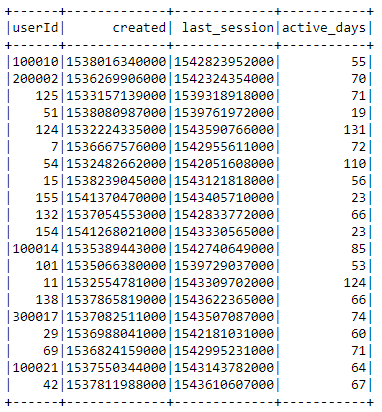
Active days
To calculate the number of days since registration, I first selected the registration column, which gives us when a user’s account was created, and the most recent value of the column ts, which gives us the timestamp of each logged event in the app.
active = spark.sql("""select userId, min(registration) as created, max(ts) as last_session
                      from sparkify_data_churn
                      group by userId""")
Both columns are formatted as Unix timestamp so I had to create a method which converts these values and calculates the difference between them in days:
def compute_active_days(created, last_session):
    """Calculates the difference between an account date of registration and
        its most recent login date.

        Parameters:
        -----------
        created
            date of creation timestamp : str
        last_session
            last login date : str

        Returns:
        --------
        active_days : int
            number of active days
        """

    created = int(created)/1000
    last_session = int(last_session)/1000

    active_days = (datetime.fromtimestamp(last_session) - datetime.fromtimestamp(created)).days
    return active_days
To use the compute_active_days function above, I needed to wrap the method as a Spark User Defined Function, them I created a new column in the active dataframe which indicates number of active days since registration.
active_days = udf(compute_active_days, IntegerType())
active = active.withColumn("active_days", active_days(active.created, active.last_session))
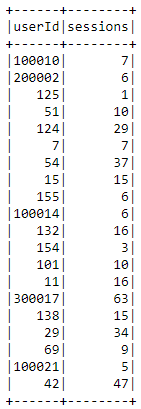
Number of sessions
sessions = spark.sql("""select userId, count(distinct sessionId) as sessions
                        from sparkify_data_churn
                        group by userId""")
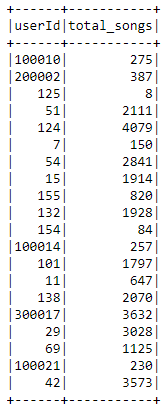
Number of listened songs
songs = spark.sql("""select userId, count(Song) as total_songs
                     from sparkify_data_churn
                     group by userId""")
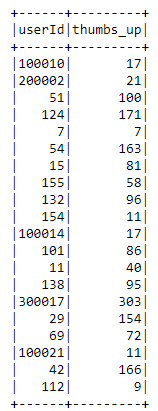
Number of thumbs up
thumbs_up = spark.sql("""select userId, count(page) as thumbs_up
                         from sparkify_data_churn
                         where page = 'Thumbs Up'
                         group by userId""")
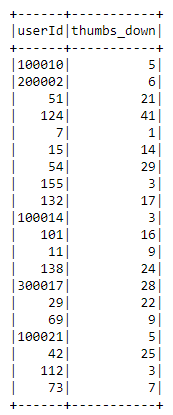
Number of thumbs down
thumbs_down = spark.sql("""select userId, count(page) as thumbs_down
                           from sparkify_data_churn
                           where page = 'Thumbs Down'
                           group by userId""")
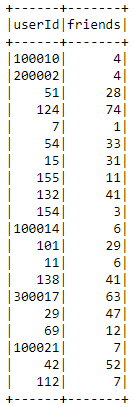
Number of added friends
friends = spark.sql("""select userId, count(page) as friends
                       from sparkify_data_churn
                       where page = 'Add Friend'
                       group by userId""")
Churn flag
Users who visited the page Cancellation confirmation will be assigned as churned. To do that, I defined another user defined function, I also created a new column to this flag:
churn = udf(lambda x: 1 if x == 'Cancellation Confirmation' else 0)
df_2 = df_2.withColumn('churn_flag', churn(df.page))
Let’s count the frequency of each flag:
spark.sql("""select churn_flag, count(churn_flag)
          from sparkify_data_churn
          group by churn_flag""").show()
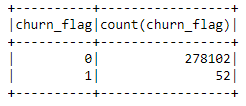
From the image above, we can see that there are only 52 churns. As there are so few churns, in the modeling part, using F1 score for model evaluation is more suitable.
Join
Now I have all the data necessary to train some models, but I first need to join all of the above datasets with the following script:
user_data = listening_time.join(thumbs_up, on='userId', how='outer')\
                         .join(thumbs_down, on='userId', how='outer')\
                         .join(songs, on='userId', how='outer')\
                         .join(sessions, on='userId', how='outer')\
                         .join(friends, on='userId', how='outer')\
                         .join(active, on='userId', how='outer')\
                         .join(churn, on='userId', how='outer')
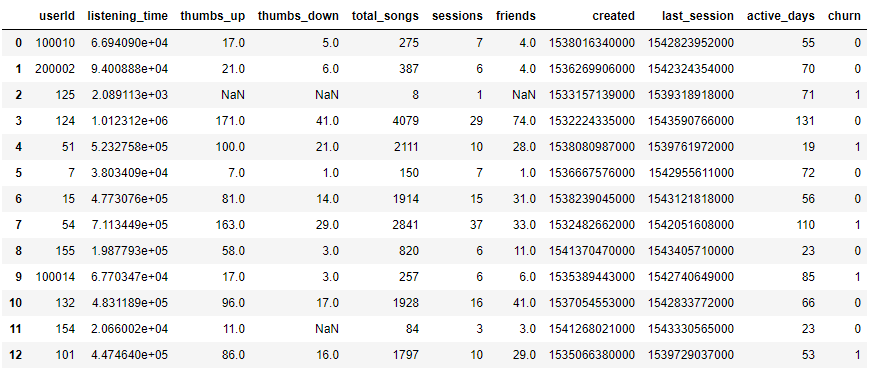
Then we get:
Filling missing values
As we can see above, there is still some work to be done:
- I’ll input NaNs with 0, as it makes sense that some users don’t have friends or never used the thumbs up/down feature of the app.
- Columns
createdandlast_sessioncan be dropped.
Both steps can be made using the following script:
full_df = user_data.drop('created').drop('last_session').fillna(0)
Which outputs as a result:
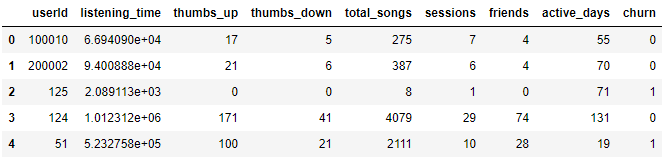
Yay! Now the data is finally ready to train some models.
Scaling
But first, as many machine learning models expect data to be scaled, this can be done with the StandardScaler class on following script:
scaler = StandardScaler(inputCol = 'features', outputCol='scaled_features')
model_df = scaler.fit(model_df).transform(model_df)
Modeling
As churn is a binary classification problem, I built three models avaiable on the pySpark API:
- Random Forest Classifier (RFC)
- Logistic Regression (LR)
- Gradient Boosted Trees (GBT)
The data was split in train and test with the randomSplit() method. 80% was used for training and 20% for testing:
train, test = model_df.randomSplit([0.8, 0.2], seed = 42)
To score the models, I used the F1 score, as there are so few churned examples, with the class MulticlassClassificationEvaluator.
evaluator = MulticlassClassificationEvaluator(
    labelCol="label", predictionCol="prediction", metricName="f1")
Results
After trained, on the test set, the F1 score of each model was:
| Model | F1 Score |
|---|---|
| RFC | 0.814 |
| LR | 0.663 |
| GBT | 0.705 |
Hyperparameter Tuning
Random Forest had the highest score, so I went futher to find the best parameters using the Spark’s classes ParamGridBuilder and CrossValidator:
param_grid = ParamGridBuilder() \
            .addGrid(rf_model.numTrees, [50, 100, 200]) \
            .addGrid(rf_model.impurity, ['gini', 'entropy']) \
            .build()

cross_val = CrossValidator(estimator=rf,
                           estimatorParamMaps=param_grid,
                           evaluator=MulticlassClassificationEvaluator(),
                           numFolds=3)
I had to setup which parameters to tune with ParamGridBuilder, in this case, the number of trees the model had and which function was used to measure the quality of a split inside those trees (gini or entropy).
I also used the CrossValidator class, which does the training and test using a 3-fold cross-validation to make sure the model is trained and tested on every part of the dataset.
As a result, the Random Forest had a slightly better F1 score of 0.84, for our purposes it stands as a good model for predicting churn, it gave the best result with 200 trees using gini impurity.
I went futher to investigate its feature importances of the best model:
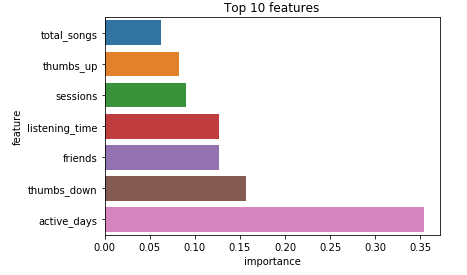
The number of active days had by far the biggest importance, with the number of thumbs down given in second place, which makes sense, maybe the user is having a bad experience on the app and that makes him more prone to churning, and the number of friends got the third place, on a tie with listening time.
Conclusion
It was a long journey, let me summarize the steps we made:
- Defined the churn problem
- Got to know the dataset
- Did a bunch of features
- Trained three models
- Tuned Random Forest
Now with the trained model we can predict if a user will churn or not considering his/her behavior inside the Sparkify app.
Reflections
In the beggining of the project I wasn’t so sure of how to exactly use the data to train a prediction model, I had to ‘sleep with the problem’ to visualize that, instead of just using the data, I could build new features on top of it.
Improvements
Futher improvements can be made, specially on which criteria is used to calculate the number of songs a user listened, as it is now, it’s only considering a song title, considering also the artist name could get more accurate numbers. Other than that, the dataset includes timestamps of every user behavior, this could be used for time series forecasting as well.
Bonus
If you want to check out how I analyzed the data, a notebook is available here.
Acknowledgments
Thanks to this Udacity for providing the dataset.